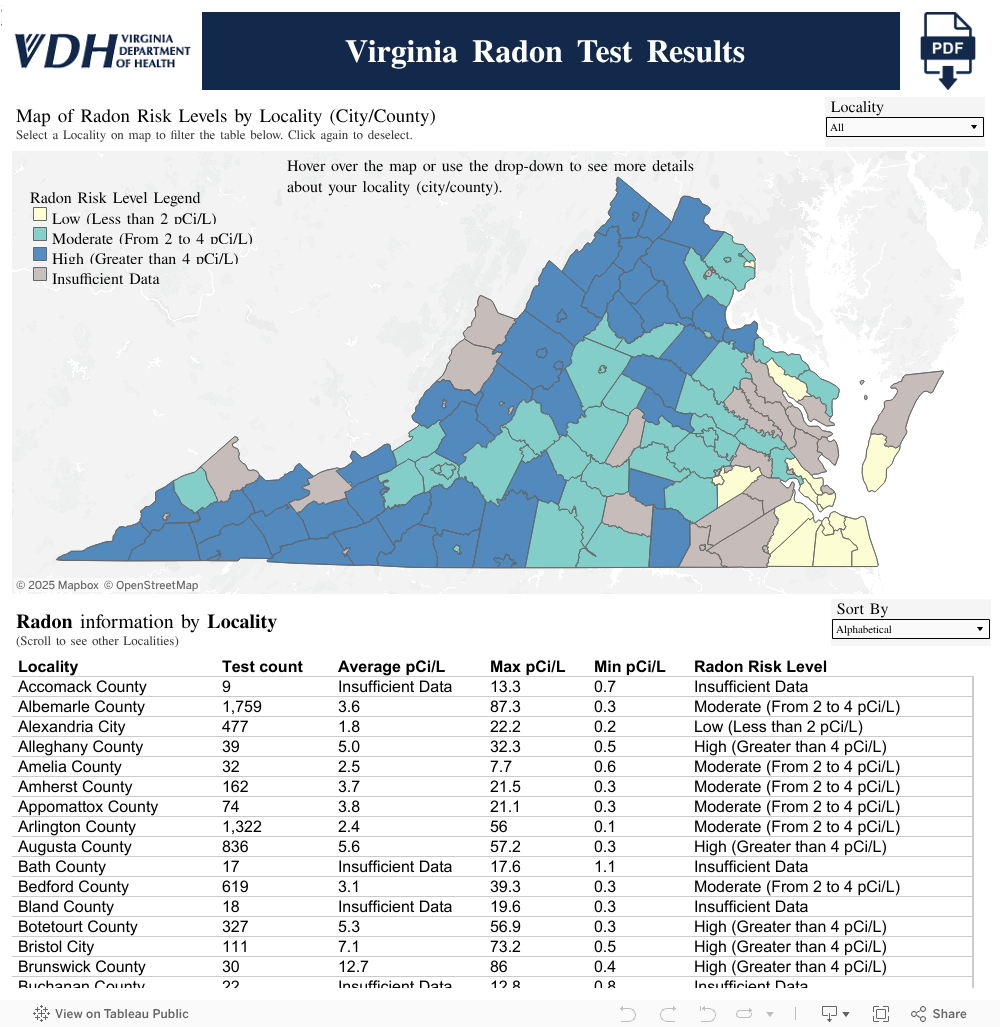
Radon Test Results
This map was created to display indoor air radon results received by VDH's Radon Program from 2016-2024. This map should not be used to predict radon risk for a single location. Radon levels vary. The only way to know is to test for it. To learn more about radon and health risk, see Radon.
Radon test data are provided by five major vendors of radon test kits. The tests were conducted by both homeowners and professional testers. Data submission to VDH is voluntary.
Test results are from 2016-2024. Colors used to indicate average radon level are as follows: High (blue), Moderate (turquoise), Low (yellow), and Gray (insufficient data).
Virginia Department of Health. Office of Radiological Health. Radon Program.
The Virginia Radon Test Result Map can be used to identify areas with a low number of test results so these areas could be targeted for additional efforts to encourage more testing. This dataset can also possibly identify which areas of the Commonwealth are at greatest risk for high indoor radon levels and that may need additional testing or mitigation assistance. The EPA action level of 4 pCi/L or higher should be used to determine if mitigation should be performed. EPA also suggests mitigation be considered if a test result is between 2 and 4 pCi/L.
Upon receipt of the raw data from the test kit vendors, VDH Office of Radiological Health staff carefully review the data to exclude the following: duplicates, blanks, post-mitigation test results, tests from inappropriate locations, and results from floors higher than ground level (second floors and higher). Data provided to VDH with missing or unknown addresses are also excluded. The goal is to include in the dataset only the first test from the lowest floor in each property that was done according to accepted EPA radon testing protocols.
For localities with a minimum of 25 test results, an average (mean) is calculated and shown on the map. For localities with < 25 pre-mitigation test results, an average was not calculated due to insufficient data. These areas are indicated with a gray color on the map.
Professional radon testers are not required to report their test data to VDH, therefore not all radon tests performed in Virginia are represented in this dataset/map. Data quality may vary between the different test kit vendors/lab. The person conducting the test may not have accurately recorded critical testing information on the report that they sent to the analytical lab.
Both low and high radon test results have been found in every Virginia city/county. Even if the local average test result appears to be low, the only way to know if a particular home has high radon is to test for it. EPA and VDH recommend that all homes be tested for radon, especially those being purchased.
Address-level testing data are not available from VDH. VDH can provide aggregate data used to produce the map, including number of tests per locality, maximum result per locality, and average result per locality.