Update: Tracking COVID-19 Disparities

The Virginia Department of Health continues to track COVID-19 disparities by race and ethnicity for cases, hospitalizations, deaths, and vaccinations. A previous post, Tracking COVID-19 Disparities, describes them from the start of the pandemic through August 2021. This update examines disparities in April 2022 to describe them at present. By continuing to revisit disparities over time, it is possible to get a sense of where they have improved and where improvement is still needed.

As the original post stated, early on in the pandemic Non-white groups had much higher rates of cases, hospitalizations, and deaths relative to White people. These disparities alleviated to varying degrees across all groups by August 2021. Latino and Asian and Pacific Islanders experienced the greatest reduction in relative rates of cases, hospitalizations, and deaths while having increased vaccination.

To date, there has been significant progress towards vaccinating people in Virginia and the effort continues. 81.7% of the Commonwealth has been vaccinated with at least one dose, 73.1% are fully vaccinated, and 2.9 million people have received a booster shot1.  Additionally, a new variant classified as Omicron has become the dominant variant in the country with cases peaking at a 7-day moving average of 14,328 in early 20223. Vaccination remains the safest way to protect against severe symptoms, hospitalization, and death from COVID-19 and its Omicron variant2.

Health Disparity Rate Ratios

Rate ratios are used here to quantify disparities by race and ethnicity for cases, hospitalizations, deaths, and vaccinations. A rate ratio compares the rate of events in different groups to a reference group and expresses it as a simple ratio. A previous blog post, Health Disparity Rate Ratios, goes into greater detail about them. In general, higher rate ratios mean higher rates within one group compared to the reference group. 

One Year Period

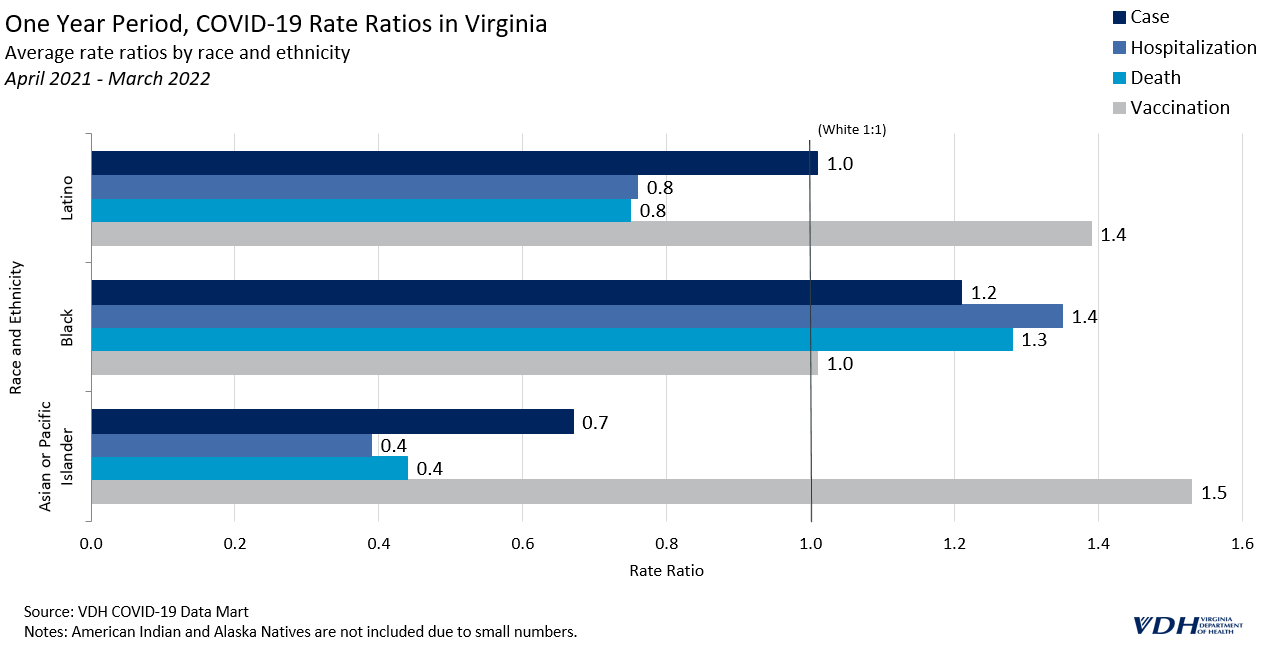
The latest rolling one-year average of rate ratios suggests that the trends in COVID-19 observed during the first half of 2021 have continued in the same direction. Vaccination rate ratios for Latino people climbed to 1.4 times that of White people, while relative hospitalization and death rates both fell to around .8.

Black people were vaccinated at about the same rate as White people throughout the last year (with a rate ratio equal to 1). Asian and Pacific Islander people had much higher vaccination rates; 1.5 times higher than White people. Black people continue to have the lowest vaccination rates relative to any other group.
 

Six Month Period

The trends seen in the last six months of data are similar to the trends for this past year, but more pronounced. For the last six months, Latino people have been vaccinated at 1.7 times the rate of White people, which is .3 higher than the one year period. Black people were vaccinated at 1.2 times the rate of White people in the past six months, which is also higher than the one year period, suggesting a positive direction for this group. 
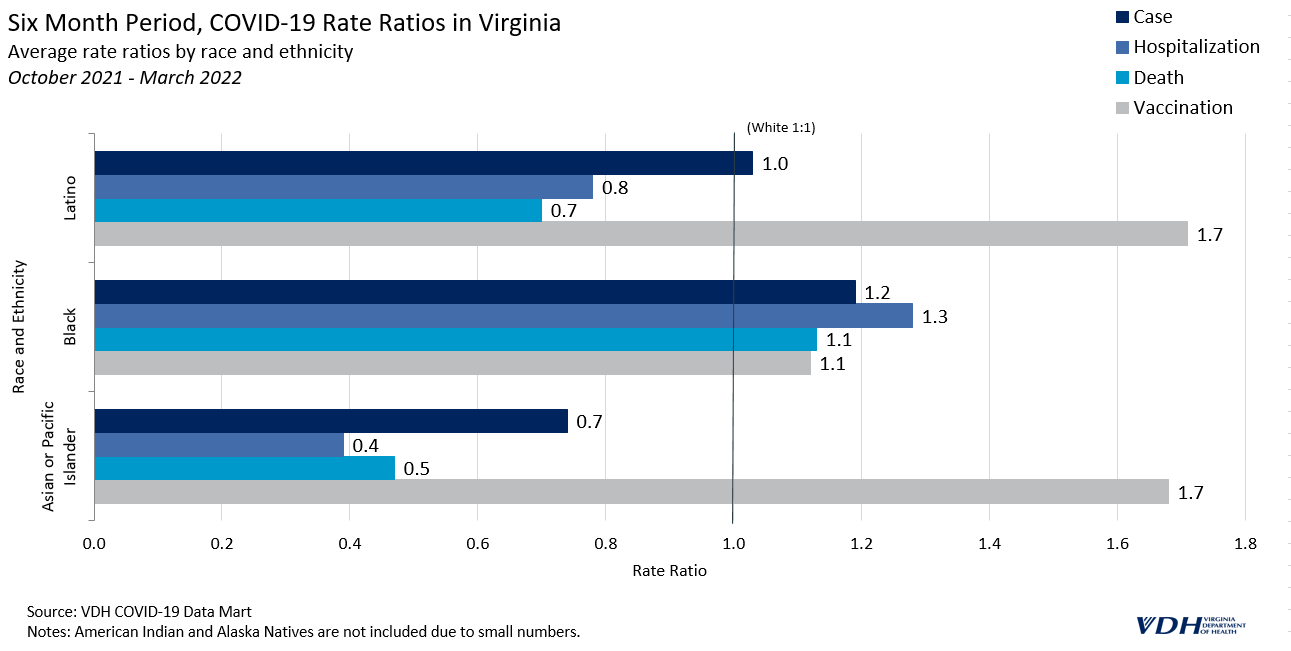


Overall, Virginia has made important progress in vaccinating people, likely contributing to lower case, hospitalization, and death rates observed among some groups. Latino people have experienced the greatest positive shift over the course of the pandemic towards higher vaccination rates and lower COVID-19 rates.

Improvements are still needed to narrow the disparities experienced by Black people, however. Black people continue to have the lowest relative rates of vaccination. While vaccination rates have recently improved among this group, they remain burdened by the highest cases, hospitalizations and death rates.

The Virginia Department of Health continues to prioritize vaccination across all groups with disparities in mind. To view changes in disparities by race and ethnicity updated monthly, please check the Health Equity dashboard page.

__

References

  1. VDH COVID-19 Data-Mart, 25 April 2022
  2. “Omicron Variant: What You Need To Know”. Cdc.Gov, 2022, https://www.cdc.gov/coronavirus/2019-ncov/variants/omicron-variant.html?s_cid=11734:omicron%20vaccine:sem.ga:p:RG:GM:gen:PTN:FY22.
  3. “CDC Museum COVID-19 Timeline”. Cdc.Gov, 2022, https://www.cdc.gov/museum/timeline/covid19.html

COVID-19 and Influenza Surveillance

How does COVID-19 relate to the flu?

People with COVID-19 and people with influenza (the flu) can have similar signs and symptoms or even none at all. Even though individual infections may look the same, there are some important differences between the two diseases.

  • Both COVID-19 and flu can cause severe illness and even death, but a larger proportion of COVID-19 cases result in hospitalization or death. 
  • More severe outcomes of COVID-19 tend to increase with age, while negative outcomes for the flu affect the very young and the very old. 
  • The reproductive number, R0 (pronounced R naught), is a value that describes how contagious a disease is. For the flu, the R0 tends to be between 1 and 2, which means that for every person infected with the flu, they will infect one to two more people. For the original COVID-19 variant, the R0 is higher than the flu, between 2 and 3. 
  • Between July and December 2021, more than 97% of sequenced samples in Virginia have been identified as the Delta variant. Delta is more than twice as contagious as previous variants of COVID-19, with an R0 that is estimated to be between 5-7. To learn more about COVID-19 variants, visit the Variants web page.
  • As of January 1 2022, the Omicron variant accounts for 95% of testing for variants of concern in the US according to the Centers for Disease Control and Prevention (CDC). A recent study estimated Omicron to be about 3 times as infectious as the Delta variant, and both variants are more contagious than previous variants.
  • The incubation period, or the time between infection and when you have symptoms, and the length of illness are both shorter for the flu than they are for COVID-19. 

It’s important for public health and healthcare providers to be able to tell the difference between the flu and COVID-19.

How does VDH track and measure  COVID-19? 

Surveillance is the practice of tracking and measuring the burden and trend of a disease’s impact on a community. VDH conducts surveillance for many diseases and conditions, but the specific methods can vary by disease or condition. For some diseases, including COVID-19, VDH conducts surveillance by counting every case and trying to measure the exact impact of the disease. The benefits of counting individual cases include:

  • Identifying health behaviors and risk factors that may be associated with more severe illness. Interviewing individual people with COVID-19 allows us to do this. . For COVID-19, we’re asking questions about living conditions, symptoms, underlying health conditions, and travel history.
  • Uncovering outbreaks. Interviewing people with COVID-19 also allows us to ask questions about exposure that may help uncover outbreaks. Asking each person about where they work or where they go to childcare or school may identify a cluster of illnesses that are connected. This can help prevent more people from getting sick at those locations.


Helping public health prevent spread of COVID-19. Knowing who is sick with COVID-19 can help public health to contact them to give steps on how to isolate (stay home) to prevent further spread.  It also allows public health to do contact tracing. Contact tracing notifies people of their exposure and provides quarantine (stay home) recommendations and support.

VDH is using the “Box It In” strategy to try and control the spread of COVID-19. This strategy is how countries like New Zealand, South Korea, and Singapore are able to control their outbreaks. This strategy requires that we count individual cases of COVID-19.

While there are benefits to counting individual cases, there are also challenges:

  • The process of interviewing individual cases is very time-consuming for public health staff.
  • The process of entering data for each case of a common disease can be time-consuming for healthcare providers.
  • Individual case counts need a large data infrastructure for exchanging, storing, and processing a high volume of data very quickly. It also needs a large workforce to analyze the data and ensure data quality.


How does VDH track and measure the flu? 

For some diseases, the benefits of counting individual cases outweigh the challenges. For others, they don’t. The flu is an example of a disease where VDH does not count individual cases. All the challenges above apply to flu surveillance as well as the others below:

  • For people who do seek care, most are diagnosed with a rapid influenza diagnostic test (RIDT) or by their symptoms alone. Diagnosing flu like this works well in the clinical setting. It  can provide access to antiviral medication that treats the flu. Unfortunately, neither RIDTs nor symptom-based diagnoses are consistent or detailed enough to meet the case classification. Because of this, public health cannot “count” the case.
  • The confirmatory tests that are available (PCR, viral culture, and DFA [direct fluorescent antigen]) for the flu are more expensive and are not used for most cases. Counting cases based on these tests alone would introduce bias. This is because  people who are wealthier, better insured, or sicker, or certain healthcare systems, may more often use these test types. 

So instead of counting each case of flu, VDH uses other data sources to track each flu season. These variables include:

  • Influenza-like illness (ILI)
    VDH receives data about every visit to an emergency department (ED) and a lot of visits to urgent care centers (UCCs) through its syndromic surveillance program. These data include some demographics and a chief complaint, or why the patient is seeking care. The chief complaint may include their specific symptoms, a specific disease, or a known exposure. VDH can track which of these visits meet the criteria of having an influenza-like illness (ILI). An ILI  is a specific mention of flu, or as a fever with either a cough, a sore throat, or both.
    This surveillance system is voluntary, and some healthcare systems have started participating in the last few years. Because more ED visits are being analyzed, VDH reports out the percentage of total ED and UCC visits that have an ILI .This data source is not a count of cases and not everyone who meets ILI criteria will have the flu. This source does provide a good estimation of the intensity and timing of the flu season. 
  • Confirmatory lab reports
    As mentioned, some tests available for the flu are confirmatory tests. One of the major benefits to these test types is that they can provide more detailed information about what type of flu virus a person has. Knowing whether we’re experiencing a flu season with a certain type of flu can be important for identifying what communities are at highest risk for complications and negative outcomes. This information also helps us to evaluate the effectiveness of the vaccine each year.
    This data source is not a count of cases. Instead, it’s intended to provide insight into which viruses are circulating at a given time.
  • Outbreaks
    Outbreaks of flu are common. VDH counts any cluster of illness with two or more lab-confirmed cases of flu as an outbreak. Reported outbreaks can be a good indicator of how much flu is spreading within a community.
  • Geographic Spread
    The geographic spread of the flu, sometimes called the activity level, calculates how many of the five health regions in Virginia are experiencing spread of the flu. This is a calculation based on ILI, confirmatory lab reports, and outbreaks. This isn’t a measure of intensity or severity. Instead it answers a yes/no question of whether flu is circulating in a specific area of the state. This can help make the data more local. Before the COVID-19 pandemic, some healthcare systems based their mask-wearing and visitation policies on the geographic spread of flu to avoid introduction of a deadly virus into communities at higher risk. 
  • Pneumonia and Influenza (P&I) Deaths
    Patients who die from the flu most often die from a complication rather than from the infection itself. They could develop pneumonia, which is a bacterial co-infection. Or, their underlying conditions could get worse. Public health tracks deaths coded as pneumonia and/or influenza (flu) together to avoid underestimating deaths associated with the flu.
  • Influenza-Associated Pediatric Mortality
    Influenza-associated pediatric mortality is a flu-associated death of a child. It is a nationally notifiable condition. This means that VDH reports every case we receive to CDC. This data source helps to measure the severity specific to the younger population. While the numbers are usually small in most states, CDC analyzes data from around the country and reports on findings from these cases. 

There are two conditions related to influenza where the benefits of counting individual cases outweigh the challenges. These are:

  • Influenza-Associated Pediatric Mortality
    It’s a tragedy when a child dies from a preventable disease. VDH counts individual cases of children who die from the flu. This helps to better define the risk factors and complications that result in this outcome. Since we started counting flu-associated deaths in children, there have been between one and six deaths each flu season. 
  • Novel Influenza A Infections
    Flu viruses, especially flu A strains, are always changing or mutating. Human infections with novel (new) flu viruses can happen in three ways: 

    •  spillover: where a sick animal infects a human, 
    • genetic drift:where small mutations in the viral genome result in a new virus, or 
    • genetic shift: (where two different flu viruses swap parts of their genomes to create something completely new). 

All three of these instances can result in a new virus that the human population does not have any immunity to, potentially leading to a pandemic. The global community is very concerned about flu pandemics so we closely monitor for these situations, perform contact tracing, and investigate the circumstances. In the United States, there have been two cases of human infection with a novel flu A virus in the past two years. Neither of these occurred in Virginia and neither resulted in additional infections.

Both of these conditions are important, but relatively rare, so the time VDH spends investigating and counting these cases is worthwhile.

What does our data tell us about the 2021-2022 flu season so far?

For surveillance purposes, each flu season in the United States begins during week 40 and lasts until week 20 of the following year. For the 2021-2022 season this is October 9, 2021 to May 21, 2022.  As of January 1, 2022, Virginia is at the ‘Widespread’ geographic activity level. This means that there was elevated influenza activity in at least three out of five health regions in Virginia. All five regions are above ILI threshold, and six outbreaks have been identified to date. For the most up-to-date information, see the Weekly Influenza Activity Report.

Looking at the Southern Hemisphere’s previous flu season can help us know what to expect in the Northern Hemisphere for the upcoming flu season. This process does not allow us to predict the future, but it can provide context and clues. During the Southern Hemisphere’s 2021 winter, they observed almost no flu activity. You can see the World Health Organization’s data on flu surveillance.

There are a few factors that could contribute to seeing such low levels of flu activity:

  • Lower attention or shifted priorities among healthcare providers. This could result in decreased testing and differences in coding behavior.
  • Decreased public health capacity could result in delays in reporting data.
  • Prevention measures put in place to stop the spread of COVID-19, such as physical distancing, mask wearing, hand hygiene, and staying home when sick, have also been effective in limiting the spread of flu..

Of these three possibilities, the third is the most likely to have a large impact, followed by the first. We know that the Southern Hemisphere did not test as many people for flu as they would have during a typical flu season. We also know that among those who were tested, a much smaller percentage were positive than we would have normally expected.

VDH will continue to track flu and publish the Weekly Influenza Activity Report throughout the 2021-2022 flu season. 

As we face rising case counts of COVID-19 coming out of the holiday season, it’s very important to make sure there are hospital beds available for those who need them. This means taking all the recommended steps to protect ourselves and our families against COVID-19 and the flu:

  • Get your flu vaccine and/or your COVID-19 vaccine (or booster) if you haven’t already done so! It’s not too late to vaccinate. Find a flu vaccine site near you.  You can also find a COVID-19 vaccine near you.
  • Wear a well-fitting mask. Limit close contact with others you do not live with, in both indoor and outdoor spaces.  
  • Practice good respiratory etiquette. Cough or sneeze away from other people into your elbow or a tissue.
  • Practice good hand hygiene. Wash your hands with soap and water for 20 seconds. Use an alcohol-based hand sanitizer that contains at least 60% alcohol if soap and water aren’t available.
  • Get tested if you have symptoms or think you’ve been exposed.
  • Follow isolation recommendations if you test positive and quarantine recommendations if you’ve been exposed to someone who tested positive.


*Originally posted on December 7, 2020.

How does VDH Count COVID-19-Associated Deaths?

The Virginia Department of Health (VDH) counts the number of deaths associated with COVID-19 to understand the impact of the COVID-19 pandemic. VDH is using national guidance (released December 2021) to assess COVID-19 deaths. These assessments are made either through the course of local public health department investigation of a COVID-19 case or through death certificate review. VDH counts a COVID-19-associated death if it meets any of the criteria below:

  1. For confirmed and probable COVID-19 cases, the case investigator determines that the patient passed away due to COVID-19. This may occur through the review of the patient’s medical record, talking with the patient’s healthcare provider, or talking with the patient’s family.
  2. VDH receives a death certificate that is matched to a known confirmed COVID-19 case and:
    • The death certificate specifically lists COVID-19 or an equivalent term as a factor in death
      OR
    • The death certificate indicates that death occurred within 30 days of the specimen collection date for the confirmatory laboratory test and the manner of death on the death certificate is documented as ‘natural’ (as opposed to ‘accident’, ‘suicide, ‘homicide’, etc.)
  3. VDH receives a death certificate that is matched to a known probable COVID-19 case and:
    • The death certificate specifically lists COVID-19 or an equivalent term as a factor in death
      OR
    • The death certificate indicates that death occurred within 30 days of the specimen collection date for the presumptive laboratory test or the symptom onset date (whichever is applicable) and the manner of death on the death certificate is documented as ‘natural’ (as opposed to ‘acident’, ‘suicide, ‘homicide’, etc.)
  4. VDH receives a death certificate and that person was not previously reported as a confirmed or probable COVID-19 case and the death certificate specifically lists COVID-19 or equivalent term as the primary cause of death. These persons are recorded as probable cases that resulted in death.

VDH does count deaths among people with underlying conditions. In these situations, it is likely that the COVID-19 infection worsened the underlying condition and the two together contributed to the patient’s death. 

Some helpful things to remember about COVID-19-associated deaths:

  • Death is one possible outcome of a COVID-19 infection. The number of deaths reported by VDH is a subset of the total number of COVID-19 cases.
  • Probable deaths are deaths that occurred in persons previously classified as probable COVID-19 cases or persons with COVID-19 listed as the primary cause of death on their death certificate and not previously reported to VDH as a COVID-19 case.
  • There is a delay between a rise in cases and a corresponding rise in deaths.
    • This is partly due to the progression of the disease – on average, death occurs a week or more after a person becomes sick with COVID-19.
    • Each death certificate is reviewed using strict criteria by a subject matter expert which takes extra time.  
  • Graphs showing the number of deaths reported by day does not represent when a death occurred.
  • There is the option to view VDH’s data on COVID-19-associated deaths by the date of death here, which is a more accurate representation of when death occurred than looking at deaths by the day they were reported.


*Originally posted on January 11, 2021.

Tracking COVID-19 Disparities

The Virginia Department of Health tracks COVID-19 disparities by race and ethnicity for cases, hospitalizations, deaths, and vaccinations. This is important because underlying health and social inequities put some racial and ethnic groups at greater risk than others. By examining disparities over the course of the pandemic, it is possible to get a sense of where they have improved and where improvement is still needed.

Early in the pandemic it became clear disparities were severe across the United States, so the Virginia Department of Health began tracking cases, deaths, and hospitalizations by race, ethnicity, age, and socioeconomic status, to learn how different groups were impacted. Mortality was disproportionately higher for racial and ethnic minority persons than for White persons.This analysis compares three different periods of the pandemic in Virginia to better understand disparities within the Commonwealth and how they have changed so far.

Health Disparity Rate Ratios

Rate ratios are used to quantify disparity. A rate ratio compares the rate of events in different groups to a reference group and expresses it as a simple ratio. A previous blog post, Health Disparity Rate Ratios, goes into greater detail about them. In general, higher rate ratios mean higher rates within one group compared to the reference group. 

March 2020 – September 2020

During the spring and summer of 2020, cases surged across the United States and disparities were more pronounced than at any other point in the pandemic. The 7-day moving average of cases in Virginia hovered around 1,000 during this time. Latino people were most impacted initially; they were more likely to get COVID-19, and subsequently die from it, compared to any other group in Virginia, with case rates consistently at least five times the rate of White people. Black people also had case and death rates that were twice as high as White people. 

Some of the early disparities in cases likely stemmed from outbreaks among front-line and essential workers, particularly those in the meat and poultry industry. Lessons learned from these early outbreaks helped to inform future responses and outreach. For example, one investigation into outbreaks in Chesterfield County and Richmond City identified lack of accessible health information in Spanish, lack of insurance and paid sick leave, and employment in frontline industries as risk factors for COVID-19 in Latino communities. Public health officials and policy-makers responded with strategies to address these disparities.


October 2020 – February 2021

In the fall of 2020 and winter of 2020-2021, the number of cases in Virginia reached new highs while racial and ethnic disparities began to decline. The 7-day moving average of cases rose from around 1,000 in October to over 5,000, and remained above 3,000 through February. This was the highest peak in cases during the pandemic so far.

During the peak, Latino people still had a case rate of about four times that of White people, but by January 2021, that number dropped to 2.2.

A similar trend can be seen for Black people, decreasing from 1.9 times that of White people to around 1.4 times. Asian or Pacific Islander people remained near or below the cumulative case rate of White people throughout the pandemic. 


March 2021 – August 2021

Disparity in COVID-19 case and death rates changed significantly after March 2021, when 21% of people in Virginia had received at least one dose of vaccine and cases briefly dipped to lower  levels. In June, the 7-day moving average was as low as 145, though it quickly returned to over 3,000. Now, with varying levels of vaccine uptake among racial and ethnic groups, COVID-19 disparities have shifted.

The current COVID-19 vaccines have been proven to be effective at preventing infection, severe illness, and death from COVID-19; they are the most important preventive measure to reduce the impact of the virus on individuals and communities. The extent to which racial and ethnic minorities are vaccinated has likely affected case and death rate disparities in Virginia.


Asian and Pacific Islander people have a higher overall vaccination rate, around 1.3 times that of White people. Additionally, Latino people are now the second most vaccinated group, while White and Black people are less likely to be vaccinated. 

Monthly rate ratios are better at indicating the direction of disparities, or current trend, than cumulative rate ratios. The following graph of monthly death rate ratios depicts a new trend from March 2021 onward, where case and death rate ratios for Latino people have better parity. Latino people had the highest death rates early in the pandemic.


Vaccine hesitancy is a significant barrier to decreasing death rates for all groups in Virginia, and is a particular issue among Black communities. Further research is needed to fully understand the impact, but the extent to which different racial and ethnic groups in Virginia are getting vaccinated is likely affecting death rates from COVID-19. Trends in COVID-19 case and death rate disparities are likely to change as more people get vaccinated. The Virginia Department of Health updates rate ratios monthly on its COVID-19 Cases & Testing Dashboards to maintain its commitment to transparently tracking COVID-19 disparities in the Commonwealth. 


__

* The impact of the Delta variant cannot be fully presented due to the lack of data points since July when it became the major variant.

*American Indian and Alaska Natives were not included in this analysis due to the small size of that population.

References

  1. Webb Hooper M, Nápoles AM, Pérez-Stable EJ. COVID-19 and Racial/Ethnic Disparities. JAMA. 2020;323(24):2466–2467. doi:10.1001/jama.2020.8598

How is VDH Calculating the Number of People Tested?

COVID-19 testing data are complex. There are several ways of looking at these numbers, and VDH has used several of these methods over the course of our COVID-19 response.

  1. Unique people tested
    The number of unique people tested is how we look at the overall number of individuals who have been tested for SARS-CoV-2, the virus that causes COVID-19, in Virginia. This method of testing will only count a person once regardless of how many times they are tested. VDH used this method originally as a way to measure the number of opportunities to identify a new case.
  2. Testing encounters or Total people tested
    VDH has referred to this measure by two names – total people tested and testing encounters. Both of these names were an attempt to communicate that this is the number of people who have been tested per day. Over the course of the COVID-19 response, some people have been tested more than once. Some of these people are healthcare workers, some are at higher risk, and some are known cases who need to have a negative test to return to work or other activities. VDH started reporting this method on May 1, 2020 as a better way to measure Virginia’s capacity to test people. It is included in the daily COVID-19 Testing  dashboard and the COVID-19 Case and Testing Data by ZIP code dashboard

Besides these two methods of measuring the number of tests Virginia has conducted, there are a few other things to keep in mind.

  • VDH is reporting test numbers that include people who do not live in Virginia. If we want to measure the state’s capacity to test for SARS-CoV-2, we need to include all tests of people who are sick enough to seek out testing while they ar in Virginia.
  • Case data and test data are two different sources. Not all cases involve a positive test, and not all positive tests count as cases. Some cases are counted based on their clinical symptoms alone, so those people are not included in testing data. Some tests are in out-of-state residents, so those people would not be included in Virginia’s case numbers. Other tests are positive for antibodies or an antigen. These tests are not as accurate as RT-PCR, the gold standard.
  • Not all tests are equal. Sensitivity is the measure of how likely a test is to identify an infection. Specificity is how likely a positive result is to be due to the exact pathogen the test is designed for. The higher the sensitivity of a test, the lower the rate of false negatives. The higher the specificity, the lower the rate of false positives. RT-PCR tests look for the virus’ genome and are both highly sensitive and highly specific. Other tests, like antibody tests, are less accurate. These tests look for the antibodies that our immune system builds after infection with a new pathogen. These antibodies take a few days or weeks to form, so a test conducted too early may not have good sensitivity. These antibodies often look similar for related pathogens. Because there are several regularly-occurring coronaviruses in the human population, some public health officials are worried about cross-reactivity. Right now, antibody results may need to be confirmed using an RT- PCR test.
  • Some tests are approved or authorized by the Food and Drug Administration (FDA) and others are not. The FDA has issued an Emergency Use Authorization (EUA) for a lot of tests when the manufacturer has been able to show good sensitivity and specificity. VDH is only reporting FDA-approved or FDA-authorized tests.


*Originally posted on May 7, 2020.