The Virginia Department of Health continues to track COVID-19 disparities by race and ethnicity for cases, hospitalizations, deaths, and vaccinations. A previous post, Tracking COVID-19 Disparities, describes them from the start of the pandemic through August 2021. This update examines disparities in April 2022 to describe them at present. By continuing to revisit disparities over time, it is possible to get a sense of where they have improved and where improvement is still needed.
As the original post stated, early on in the pandemic Non-white groups had much higher rates of cases, hospitalizations, and deaths relative to White people. These disparities alleviated to varying degrees across all groups by August 2021. Latino and Asian and Pacific Islanders experienced the greatest reduction in relative rates of cases, hospitalizations, and deaths while having increased vaccination.
To date, there has been significant progress towards vaccinating people in Virginia and the effort continues. 81.7% of the Commonwealth has been vaccinated with at least one dose, 73.1% are fully vaccinated, and 2.9 million people have received a booster shot1. Additionally, a new variant classified as Omicron has become the dominant variant in the country with cases peaking at a 7-day moving average of 14,328 in early 20223. Vaccination remains the safest way to protect against severe symptoms, hospitalization, and death from COVID-19 and its Omicron variant2.
Health Disparity Rate Ratios
Rate ratios are used here to quantify disparities by race and ethnicity for cases, hospitalizations, deaths, and vaccinations. A rate ratio compares the rate of events in different groups to a reference group and expresses it as a simple ratio. A previous blog post, Health Disparity Rate Ratios, goes into greater detail about them. In general, higher rate ratios mean higher rates within one group compared to the reference group.
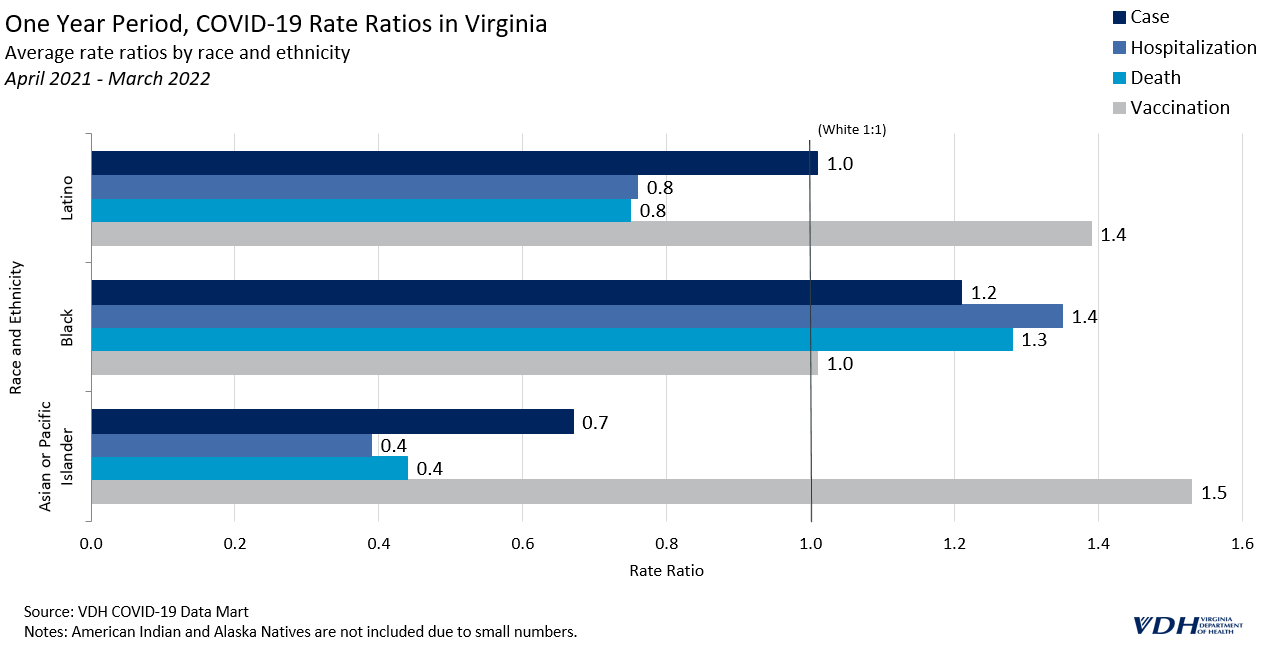
One Year Period
The latest rolling one-year average of rate ratios suggests that the trends in COVID-19 observed during the first half of 2021 have continued in the same direction. Vaccination rate ratios for Latino people climbed to 1.4 times that of White people, while relative hospitalization and death rates both fell to around .8.
Black people were vaccinated at about the same rate as White people throughout the last year (with a rate ratio equal to 1). Asian and Pacific Islander people had much higher vaccination rates; 1.5 times higher than White people. Black people continue to have the lowest vaccination rates relative to any other group.
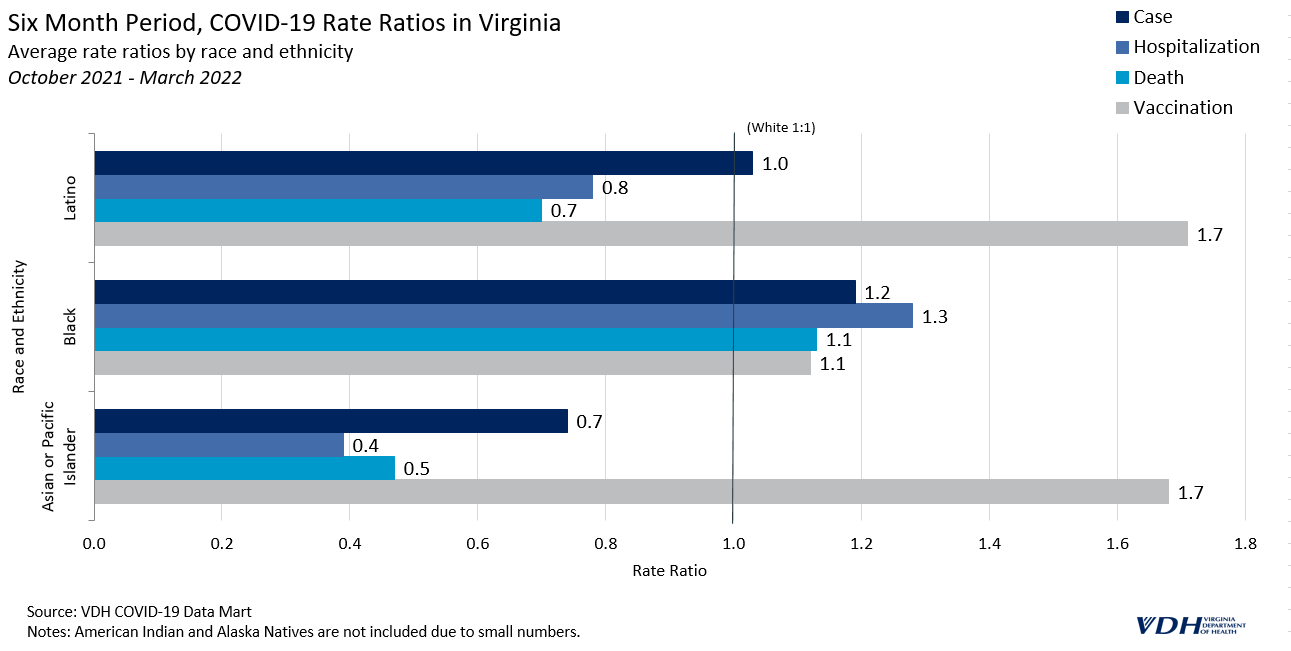
Six Month Period
The trends seen in the last six months of data are similar to the trends for this past year, but more pronounced. For the last six months, Latino people have been vaccinated at 1.7 times the rate of White people, which is .3 higher than the one year period. Black people were vaccinated at 1.2 times the rate of White people in the past six months, which is also higher than the one year period, suggesting a positive direction for this group.
Overall, Virginia has made important progress in vaccinating people, likely contributing to lower case, hospitalization, and death rates observed among some groups. Latino people have experienced the greatest positive shift over the course of the pandemic towards higher vaccination rates and lower COVID-19 rates.
Improvements are still needed to narrow the disparities experienced by Black people, however. Black people continue to have the lowest relative rates of vaccination. While vaccination rates have recently improved among this group, they remain burdened by the highest cases, hospitalizations and death rates.
The Virginia Department of Health continues to prioritize vaccination across all groups with disparities in mind. To view changes in disparities by race and ethnicity updated monthly, please check the Health Equity dashboard page.
__
References
VDH COVID-19 Data-Mart, 25 April 2022
“Omicron Variant: What You Need To Know”. Cdc.Gov, 2022, https://www.cdc.gov/coronavirus/2019-ncov/variants/omicron-variant.html?s_cid=11734:omicron%20vaccine:sem.ga:p:RG:GM:gen:PTN:FY22.
“CDC Museum COVID-19 Timeline”. Cdc.Gov, 2022, https://www.cdc.gov/museum/timeline/covid19.html
The Virginia Department of Health tracks COVID-19 disparities by race and ethnicity for cases, hospitalizations, deaths, and vaccinations. This is important because underlying health and social inequities put some racial and ethnic groups at greater risk than others. By examining disparities over the course of the pandemic, it is possible to get a sense of where they have improved and where improvement is still needed.
Early in the pandemic it became clear disparities were severe across the United States, so the Virginia Department of Health began tracking cases, deaths, and hospitalizations by race, ethnicity, age, and socioeconomic status, to learn how different groups were impacted. Mortality was disproportionately higher for racial and ethnic minority persons than for White persons.1 This analysis compares three different periods of the pandemic in Virginia to better understand disparities within the Commonwealth and how they have changed so far.
Health Disparity Rate Ratios
Rate ratios are used to quantify disparity. A rate ratio compares the rate of events in different groups to a reference group and expresses it as a simple ratio. A previous blog post, Health Disparity Rate Ratios, goes into greater detail about them. In general, higher rate ratios mean higher rates within one group compared to the reference group.
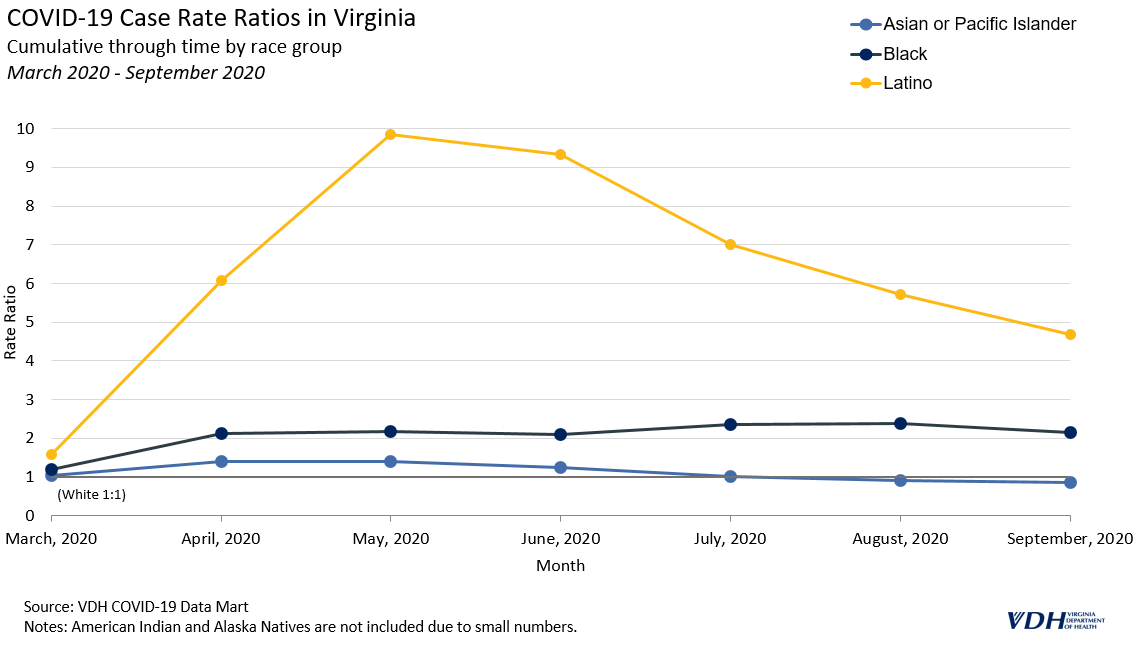
March 2020 – September 2020
During the spring and summer of 2020, cases surged across the United States and disparities were more pronounced than at any other point in the pandemic. The 7-day moving average of cases in Virginia hovered around 1,000 during this time. Latino people were most impacted initially; they were more likely to get COVID-19, and subsequently die from it, compared to any other group in Virginia, with case rates consistently at least five times the rate of White people. Black people also had case and death rates that were twice as high as White people.
Some of the early disparities in cases likely stemmed from outbreaks among front-line and essential workers, particularly those in the meat and poultry industry. Lessons learned from these early outbreaks helped to inform future responses and outreach. For example, one investigation into outbreaks in Chesterfield County and Richmond City identified lack of accessible health information in Spanish, lack of insurance and paid sick leave, and employment in frontline industries as risk factors for COVID-19 in Latino communities. Public health officials and policy-makers responded with strategies to address these disparities.
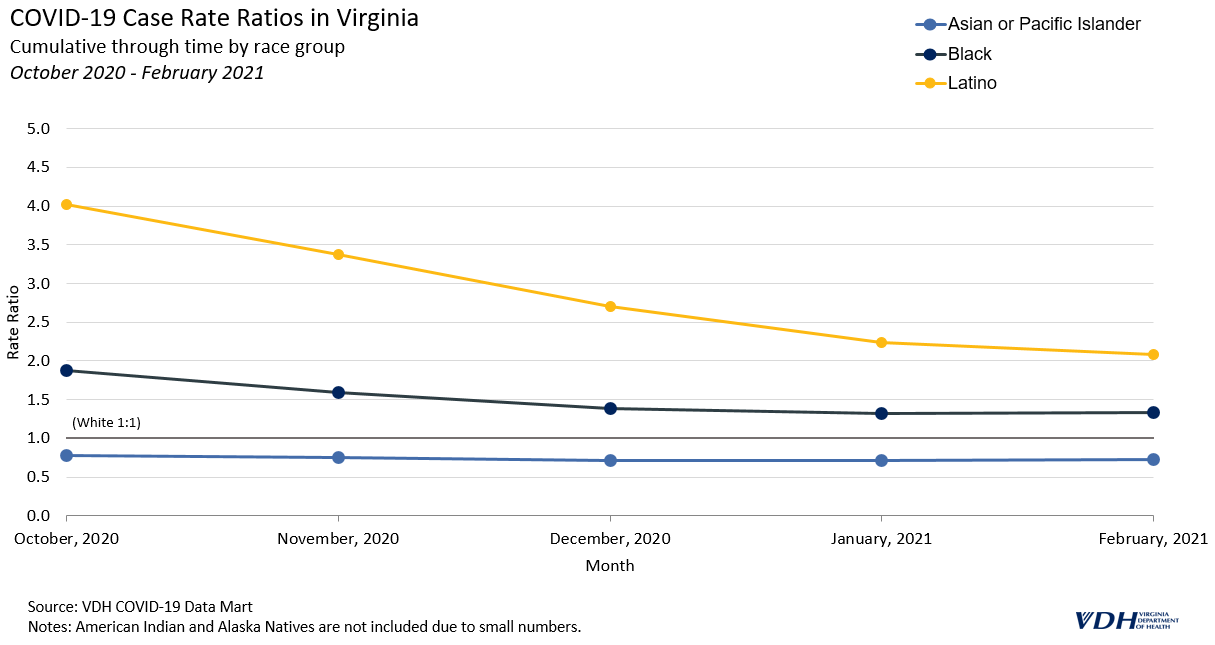
October 2020 – February 2021
In the fall of 2020 and winter of 2020-2021, the number of cases in Virginia reached new highs while racial and ethnic disparities began to decline. The 7-day moving average of cases rose from around 1,000 in October to over 5,000, and remained above 3,000 through February. This was the highest peak in cases during the pandemic so far.
During the peak, Latino people still had a case rate of about four times that of White people, but by January 2021, that number dropped to 2.2.
A similar trend can be seen for Black people, decreasing from 1.9 times that of White people to around 1.4 times. Asian or Pacific Islander people remained near or below the cumulative case rate of White people throughout the pandemic.
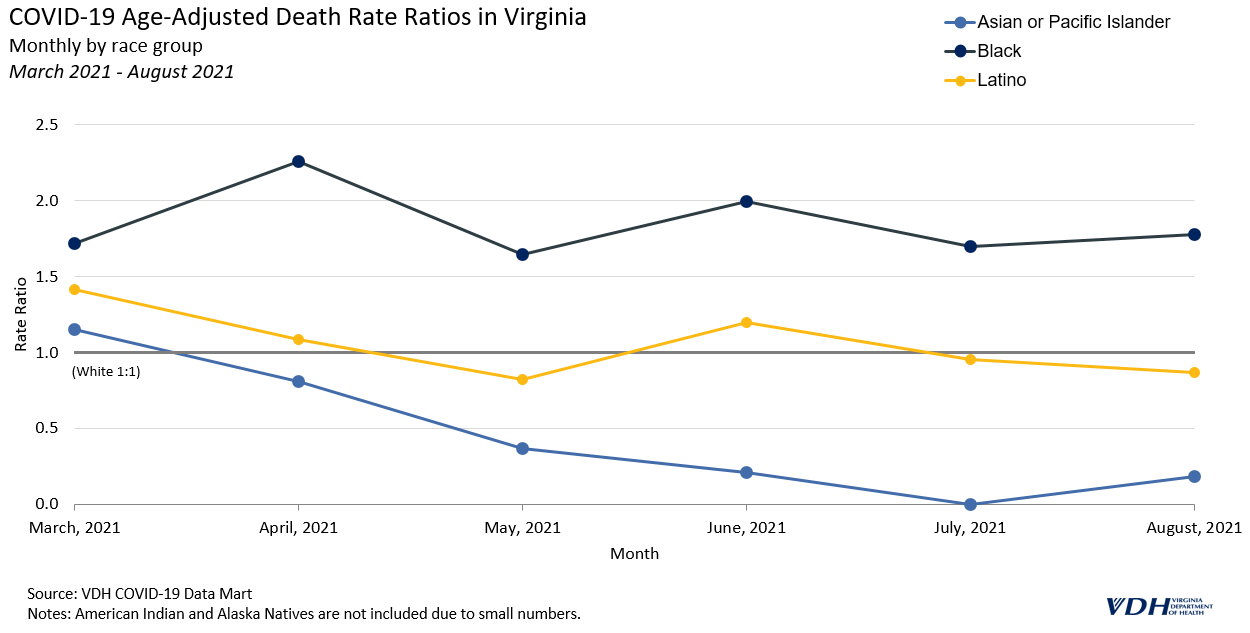
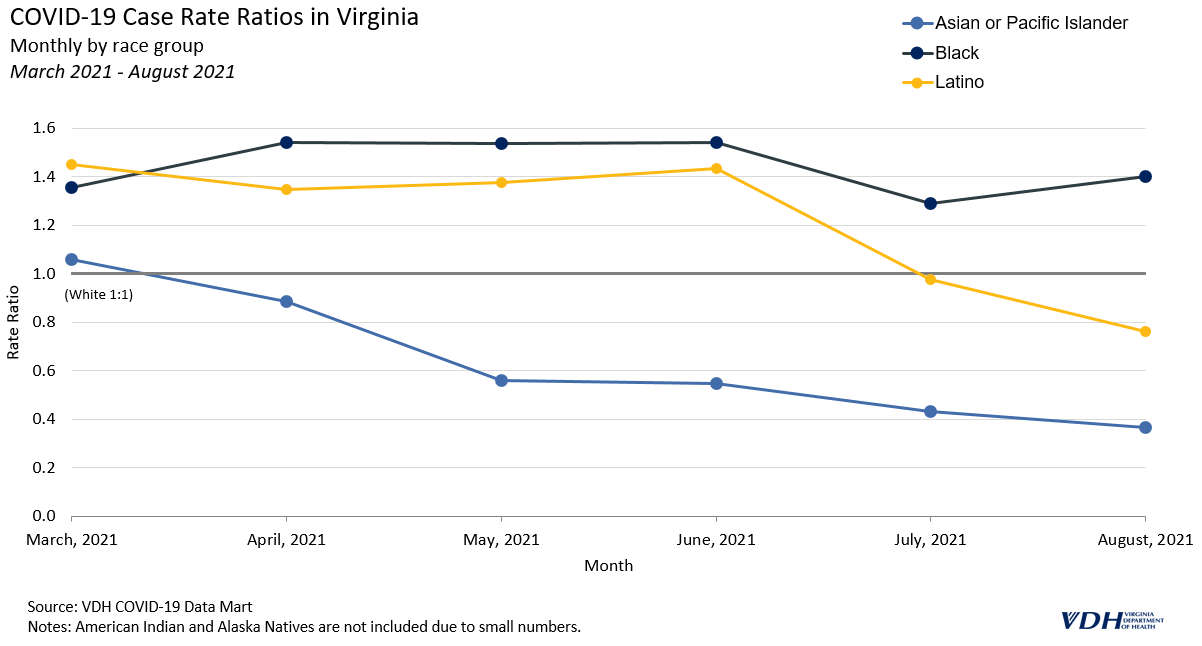
March 2021 – August 2021
Disparity in COVID-19 case and death rates changed significantly after March 2021, when 21% of people in Virginia had received at least one dose of vaccine and cases briefly dipped to lower levels. In June, the 7-day moving average was as low as 145, though it quickly returned to over 3,000. Now, with varying levels of vaccine uptake among racial and ethnic groups, COVID-19 disparities have shifted.
The current COVID-19 vaccines have been proven to be effective at preventing infection, severe illness, and death from COVID-19; they are the most important preventive measure to reduce the impact of the virus on individuals and communities. The extent to which racial and ethnic minorities are vaccinated has likely affected case and death rate disparities in Virginia.
Asian and Pacific Islander people have a higher overall vaccination rate, around 1.3 times that of White people. Additionally, Latino people are now the second most vaccinated group, while White and Black people are less likely to be vaccinated.
Monthly rate ratios are better at indicating the direction of disparities, or current trend, than cumulative rate ratios. The following graph of monthly death rate ratios depicts a new trend from March 2021 onward, where case and death rate ratios for Latino people have better parity. Latino people had the highest death rates early in the pandemic.
Vaccine hesitancy is a significant barrier to decreasing death rates for all groups in Virginia, and is a particular issue among Black communities. Further research is needed to fully understand the impact, but the extent to which different racial and ethnic groups in Virginia are getting vaccinated is likely affecting death rates from COVID-19. Trends in COVID-19 case and death rate disparities are likely to change as more people get vaccinated. The Virginia Department of Health updates rate ratios monthly on its COVID-19 Cases & Testing Dashboards to maintain its commitment to transparently tracking COVID-19 disparities in the Commonwealth.
__
* The impact of the Delta variant cannot be fully presented due to the lack of data points since July when it became the major variant.
*American Indian and Alaska Natives were not included in this analysis due to the small size of that population.
References
Webb Hooper M, Nápoles AM, Pérez-Stable EJ. COVID-19 and Racial/Ethnic Disparities. JAMA. 2020;323(24):2466–2467. doi:10.1001/jama.2020.8598
The March 8, 2021 COVID-19 Health and Disease Disparities by Race and Ethnicity in Virginia blog post presented disparities data through February. COVID-19 case, hospitalization, death and vaccination rates for each racial/ethnic group were compared to the White group rate in the form of a rate ratio. For example, if the Black group rate was 2 and the White group rate was 1, then the rate ratio would be 2 and would mean that the Black group rate was 2 times higher than that of the White group. Death rates are age-adjusted, while case, hospitalization and vaccination rates are not.
Health equity is a cornerstone of public health. This is especially true during the COVID-19 pandemic when many populations are suffering from both the health and economic consequences of the disease. Accurate information on disparities in disease incidence, outcomes, and social and economic impacts is necessary to guide and develop an appropriate response. Efforts to study these disparities have been hampered by missing data. Almost a quarter of confirmed cases are missing race and ethnicity data. Accounting for this missing data is essential to understanding COVID-19 and to facilitate research into health disparities.
This post provides an update to imputed case data initially published in August 2020. This data is intended for research purposes and to assist understanding of COVID-19-related health disparities. The COVID-19 Daily Dashboard will continue to report the unimputed data, including the number of cases with race and ethnicity not reported. Virginia Department of Health Surveillance and Investigations staff continue to pursue multiple strategies to fill in missing data.
COVID-19 Health and Disease Disparities by Race and Ethnicity in Virginia
Racial and ethnic health disparities illuminate areas where significant health and disease inequity exists. Unfortunately these disparities exist far too often in the United States and Virginia, and this is no different for key measures of the COVID-19 pandemic. Disparities in COVID-19 case, death and vaccination rates havebeendemonstratedin the United States and have been particularly unfavorable to Hispanic and Black populations. Life expectancy in the United States is projected to be reduced at least 3 times more for Hispanic and Black populations than for White populations as a result of COVID-19, wiping out ten years of progress in bridging the life expectancy gap between White and Black Americans. But opportunities exist as there is both an abundance of data being collected about and resources being directed to addressing COVID-19 and its complications. By recognizing these disparities and prioritizing strategies to address them, overall population health and that of the most at-risk subpopulations can be improved.
COVID-19 Cases
COVID-19 case rates in Virginia are substantially higher for Hispanic and Black populations than for other racial/ethnic groups. When compared to the White case rate, the Black case rate is 1.3 times higher and the Hispanic rate is 2.1 times higher. The Asian and Pacific Islander population has the lowest case rate at 0.7 times that of the White population.
COVID-19 Hospitalizations
COVID-19 hospitalization rates are also higher for the Hispanic and Black populations than for other racial and ethnic groups. When compared to the White COVID-19 hospitalization rate, the Black rate is 2.0 times higher and the Hispanic rate is 2.6 times higher. American Indians and Alaska Natives (AIAN) have the lowest hospitalization rate, at 0.6 times that of the White population, although racial misclassification is common for health outcomes of American Indians, which can lead to falsely lower rates.
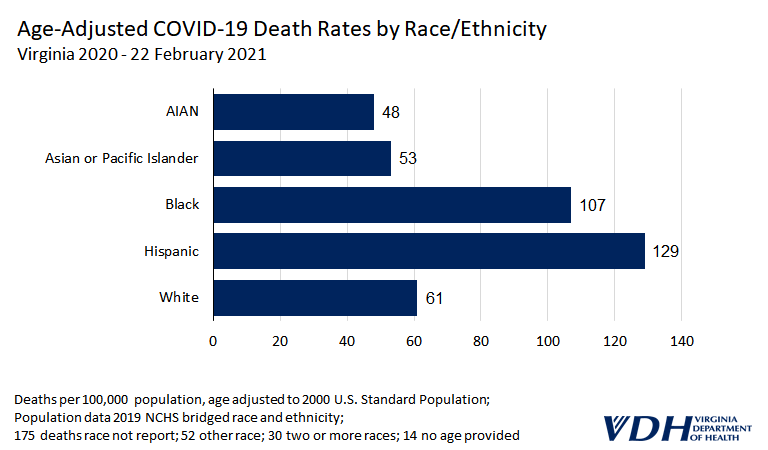
COVID-19 Deaths
When comparing deaths among racial and ethnic groups, the analysis needs to account for the increased risk of death among older persons. For example, when comparing death rates of an older White population to a younger Hispanic population, age would be a contributing factor to any differences. One way to do this is to compare age group specific death rates for each racial/ethnic group. In Virginia, Hispanic and Black age-specific death rates are much higher than White age-specific death rates. The age group with the largest disparity was 35-44 year olds, with the Hispanic death rate 10.9 times higher and the Black rate 6.3 times higher than the White death rate. After this age group the size of the disparity steadily decreases. Among persons 85 years and older, the Hispanic rate is similar to the White rate, and the Black rate is 1.1 times higher than the White rate.
Another approach is to use age-adjusted rates. When compared to the White rate through February 22, 2021, the Hispanic age-adjusted COVID-19 death rate was 2.1 times higher; the Black rate was 1.8 times higher; the Asian rate was 0.9 times that of the White rate, and the American Indian/Alaska Native rate was 0.8 times that of the White rate. The disparities in death rates were worse earlier in the pandemic and decreased over time. When compared to the White rate through May 31, 2020, the Hispanic age-adjusted death rate was 3.5 times higher, the Black rate was 1.9 times higher, and the Asian rate was 1.8 times higher. In general, when compared to the White population, all other racial/ethnic groups’ age-adjusted death rates improved throughout the pandemic – even before vaccination was introduced. Hispanic to White population comparisons illustrate this most clearly. When compared to the White rate, the Hispanic rate was 3.5 times higher (May 31, 2020), then 3.1 times higher (September 30, 2020), then 2.4 times higher (December 22, 2020), and then 2.1 times higher (February 22, 2020).
COVID-19 Vaccinations
NOTE: The data in this section is outdated. Please refer to more recent posts for current data.
One of the key strategies to reduce disparities in infectious disease rates is vaccination. Ideally COVID-19 racial and ethnic disparities will lessen as the vaccination campaign in Virginia progresses. As of February 26, 2021, Black individuals had been vaccinated at a rate 0.6 times lower than White individuals. Hispanic and Asian/Pacific Islander individuals had even lower rates, at 0.5 times that of White individuals. When looking at only the 65 years and older population, which has been prioritized for vaccination, some of the vaccination rate disparities are smaller (Asian/Pacific Islander rate is 0.5 times lower than the White rate, Black rate is0.7 times lower and the Hispanic rate is 0.8 times lower.
Discussion
Opportunities for and threats to health in the United States and Virginia are distributed by race/ethnicity. The same exists during the COVID-19 pandemic. COVID-19 case, hospitalization and death rates are all greater for Black and Hispanic populations in Virginia. Differences in key social determinants of health, such as income, employment, and education contribute to these population-level disparities. More Hispanic adults in the United States reported stress about not having enough food (22.7%) or adequate housing (20.7%) than did White adults (11.9% and 9.2%, respectively). In addition, the risk of COVID-19 is increased for some racial/ethnic groups because they may be more likely to have less access to health care, reside in congregate living facilities and prisons, live in multigenerational families and hold jobs requiring in-person work (Gold, 2020). Additionally Black and Hispanic communities have higher rates of chronic health conditions, such as diabetes and high blood pressure, that are associated with complications and increased risk of death from COVID-19.
The United States and Virginia were overwhelmed by COVID-19 and particularly so at the beginning of the pandemic. Therefore it is not surprising that COVID-19 death disparities were greater at the beginning of the pandemic as groups at higher risk were more likely to be impacted. Unfortunately this also happens with other health problems as social determinants of health are maldistributed. These disparities will continue health problem by health problem until there is more equity in the distribution of social determinants of health across racial/ethnic groups.
Next Steps
It is critically important to continue to improve the tracking of racial and ethnic health and disease disparities. Since COVID-19 is the current major threat to health, this is a good place to work on improvements. The Virginia Department of Health (VDH) is prioritizing race and ethnicity as it upgrades its informatics systems in response to COVID-19, including ensuring race and ethnicity data are collected in a consistent manner across data systems, and that Hispanic ethnicity is presented alongside racial groups in the same tables and figures to allow for comparisons within Virginia and with other states. Additionally key interventions such as vaccination are being tracked by race and ethnicity to assure disparities are addressed.
VDH has worked to reduce missing data through communications, data matching, and requiring race and ethnicity fields when appropriate; however, missing race and ethnicity data continues to be an issue. While death records are mostly complete, the case, hospitalization, and vaccination data reported above still reflect significant amounts of missing data. VDH has adopted an imputation method to fill these gaps. More information using this method will be available in the coming weeks. The best way to protect the health of all Virginians is to reduce health disparities, ensuring we all prosper together.