The Virginia Department of Health continues to track COVID-19 disparities by race and ethnicity for cases, hospitalizations, deaths, and vaccinations. A previous post, Tracking COVID-19 Disparities, describes them from the start of the pandemic through August 2021. This update examines disparities in April 2022 to describe them at present. By continuing to revisit disparities over time, it is possible to get a sense of where they have improved and where improvement is still needed.
As the original post stated, early on in the pandemic Non-white groups had much higher rates of cases, hospitalizations, and deaths relative to White people. These disparities alleviated to varying degrees across all groups by August 2021. Latino and Asian and Pacific Islanders experienced the greatest reduction in relative rates of cases, hospitalizations, and deaths while having increased vaccination.
To date, there has been significant progress towards vaccinating people in Virginia and the effort continues. 81.7% of the Commonwealth has been vaccinated with at least one dose, 73.1% are fully vaccinated, and 2.9 million people have received a booster shot1. Additionally, a new variant classified as Omicron has become the dominant variant in the country with cases peaking at a 7-day moving average of 14,328 in early 20223. Vaccination remains the safest way to protect against severe symptoms, hospitalization, and death from COVID-19 and its Omicron variant2.
Health Disparity Rate Ratios
Rate ratios are used here to quantify disparities by race and ethnicity for cases, hospitalizations, deaths, and vaccinations. A rate ratio compares the rate of events in different groups to a reference group and expresses it as a simple ratio. A previous blog post, Health Disparity Rate Ratios, goes into greater detail about them. In general, higher rate ratios mean higher rates within one group compared to the reference group.
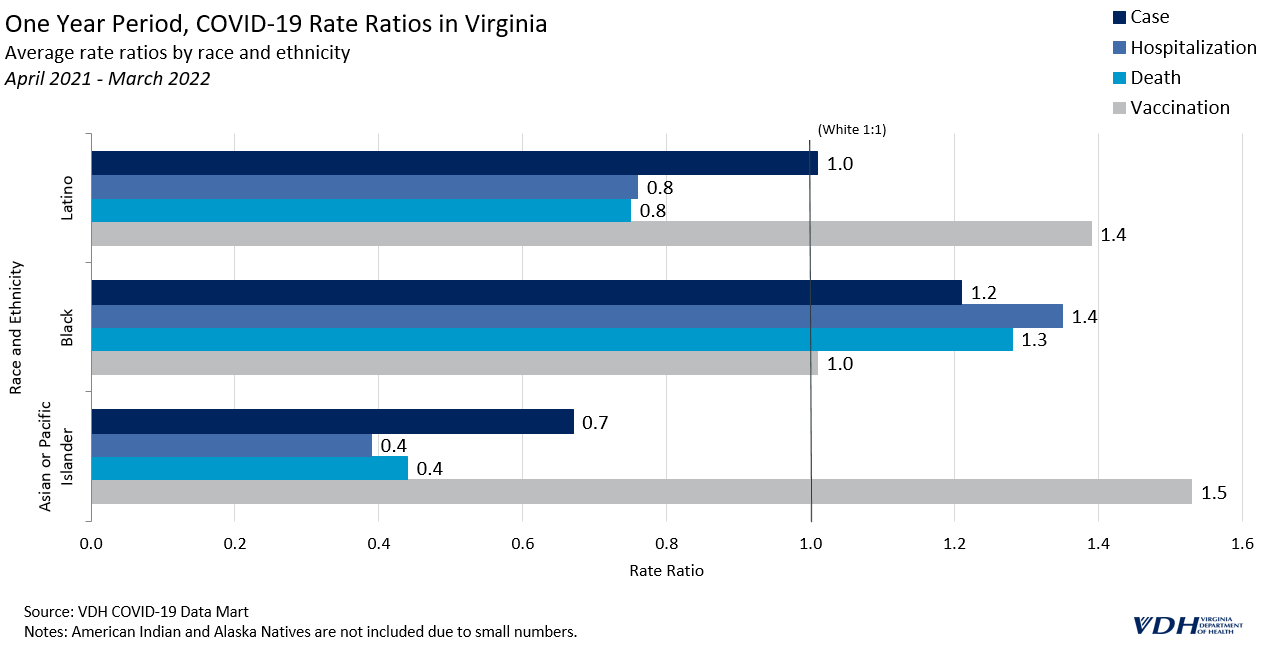
One Year Period
The latest rolling one-year average of rate ratios suggests that the trends in COVID-19 observed during the first half of 2021 have continued in the same direction. Vaccination rate ratios for Latino people climbed to 1.4 times that of White people, while relative hospitalization and death rates both fell to around .8.
Black people were vaccinated at about the same rate as White people throughout the last year (with a rate ratio equal to 1). Asian and Pacific Islander people had much higher vaccination rates; 1.5 times higher than White people. Black people continue to have the lowest vaccination rates relative to any other group.
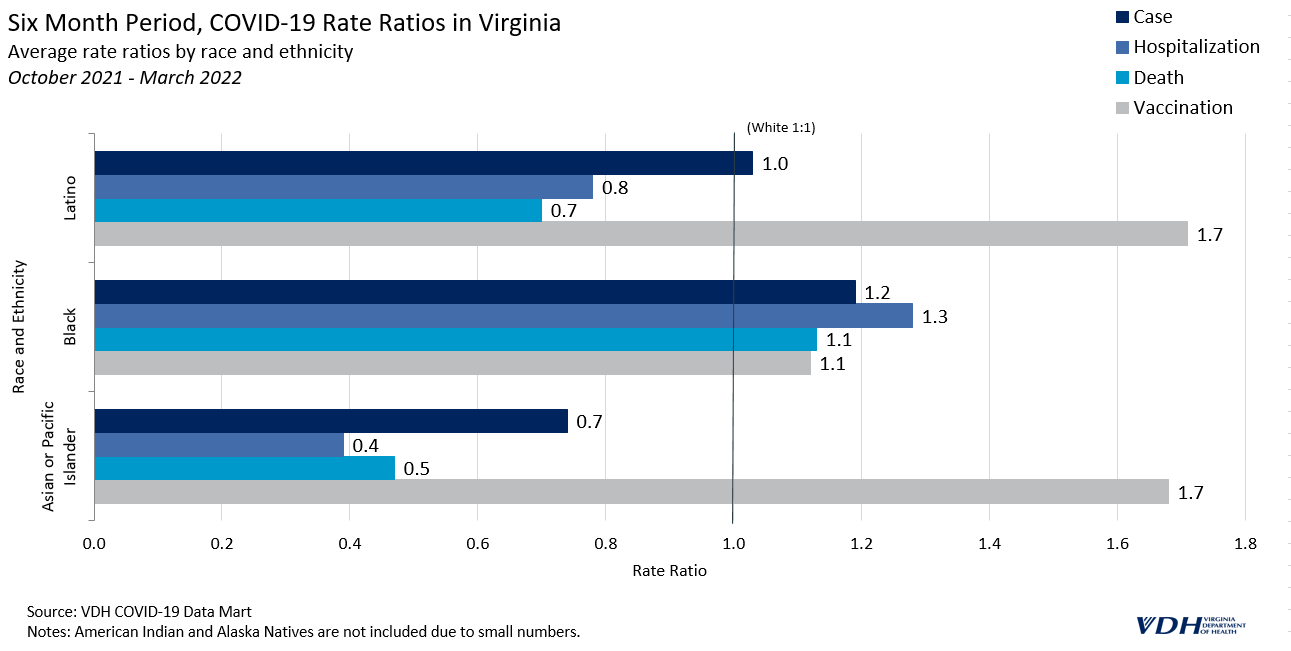
Six Month Period
The trends seen in the last six months of data are similar to the trends for this past year, but more pronounced. For the last six months, Latino people have been vaccinated at 1.7 times the rate of White people, which is .3 higher than the one year period. Black people were vaccinated at 1.2 times the rate of White people in the past six months, which is also higher than the one year period, suggesting a positive direction for this group.
Overall, Virginia has made important progress in vaccinating people, likely contributing to lower case, hospitalization, and death rates observed among some groups. Latino people have experienced the greatest positive shift over the course of the pandemic towards higher vaccination rates and lower COVID-19 rates.
Improvements are still needed to narrow the disparities experienced by Black people, however. Black people continue to have the lowest relative rates of vaccination. While vaccination rates have recently improved among this group, they remain burdened by the highest cases, hospitalizations and death rates.
The Virginia Department of Health continues to prioritize vaccination across all groups with disparities in mind. To view changes in disparities by race and ethnicity updated monthly, please check the Health Equity dashboard page.
__
References
- VDH COVID-19 Data-Mart, 25 April 2022
- “Omicron Variant: What You Need To Know”. Cdc.Gov, 2022, https://www.cdc.gov/coronavirus/2019-ncov/variants/omicron-variant.html?s_cid=11734:omicron%20vaccine:sem.ga:p:RG:GM:gen:PTN:FY22.
- “CDC Museum COVID-19 Timeline”. Cdc.Gov, 2022, https://www.cdc.gov/museum/timeline/covid19.html