Stroke is the 4th Leading Cause of Death in Virginia (2023).
How does VDH epidemiology define Cerebrovascular Disease and Stroke?
Cerebrovascular diseases are disorders in which an area of the brain is temporarily or permanently affected by a lack of blood flow or bleeding from one or more blood vessels in the brain. Stroke is a type of cerebrovascular disease.
Stroke includes two main categories:
-
- Ischemic Strokes are blockages of blood vessels.
- Hemorrhagic Strokes are due to ruptured blood vessels.
Learn more about stroke and how it affects people in Virginia in the Cerebrovascular Disease and Stroke Burden Report 2023.
Stroke mortality rates per 100,000 population have decreased from 42.1 in 2020 to 39.8 in 2024.
The below graph displays trends in Age-Adjusted Stroke Mortality Rates in Virginia, 2020-2024. The disease specifications are defined by the following ICD-10 discharge codes: Cerebrovascular - I60-I69, Intracerebral Hemorrhage (ICH) - I60-I62, and Acute Ischemic Stroke (AIS) - I63-I69.
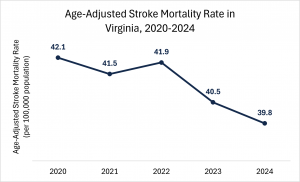
Data Source: Vital Event Statistics Program, Office of Information Management, Virginia Department of Health.
The below graph displays trends in Age-Adjusted Stroke Mortality Rates by Age in Virginia, 2020-2024. The disease specifications are defined by the following ICD-10 discharge codes: Cerebrovascular - I60-I69, Intracerebral Hemorrhage (ICH) - I60-I62, and Acute Ischemic Stroke (AIS) - I63-I69.
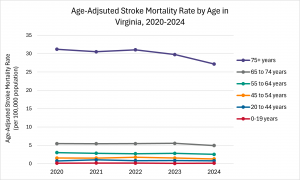
Data Source: Vital Event Statistics Program, Office of Information Management, Virginia Department of Health.
The below map displays the Age-Adjusted Stroke Mortality Rates by Locality in Virginia, 2023. The disease specifications are defined by the following ICD-10 discharge codes: Cerebrovascular - I60-I69, Intracerebral Hemorrhage (ICH) - I60-I62, and Acute Ischemic Stroke (AIS) - I63-I69.
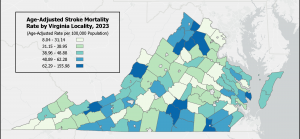
Data Source: Vital Event Statistics Program, Office of Information Management, Virginia Department of Health.
Click Here for the accompanying data table: ![]() Data Table
Data Table
Stroke hospitalization rates per 100,000 population have increased from 229.6 in 2020 to 244.1 in 2024.
The below graph displays trends in Age-Adjusted Stroke Hospitalization Rates in Virginia, 2020-2024. The disease specifications are defined by the following ICD-10 discharge codes: Transient Ischemic Attack (TIA) -G45-G46, Intracerebral Hemorrhage (ICH) - I60-I62, and Acute Ischemic Stroke (AIS) - I63-I69.
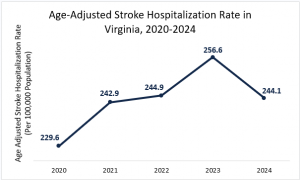
Data Source: Virginia Health Information.
The below graph displays trends in Age-Adjusted Stroke Hospitalization Rates by Age in Virginia, 2020-2024. The disease specifications are defined by the following ICD-10 discharge codes: Transient Ischemic Attack (TIA) -G45-G46, Intracerebral Hemorrhage (ICH) - I60-I62, and Acute Ischemic Stroke (AIS) - I63-I69.
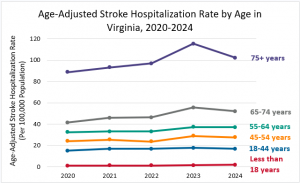
Data Source: Virginia Health Information.
Additional Stroke Data Resources
- VDH Chronic Disease Dashboard
Visit the VDH Chronic Disease Dashboard to view chronic disease hospitalizations, prevalence, and mortality across Virginia. - Stroke Burden Report 2023
Progress report on the burden of stroke and stroke-related events in Virginia. (Updated December 2024) - VDH Office of EMS - EMS & Trauma Data
Visit VDH Office of EMS DATAWISE Team's page for EMS and trauma data. - Behavioral Risk Factor Surveillance System (BRFSS)
The BRFSS, the world’s largest telephone survey, tracks health risks in the United States. Information from the survey is used to improve the health of the American people. - Heart Disease and Stroke Statistics from the American Heart Association
The American Heart Association works with government agencies to derive our annual statistics for cardiovascular diseases, including coronary heart disease, stroke and high blood pressure. - Interactive Atlas of Heart Disease and Stroke
CDC’s Interactive Atlas of Heart Disease and Stroke is an online mapping tool that allows users to create and customize county-level maps of heart disease and stroke by race and ethnicity, gender, age group, and more.