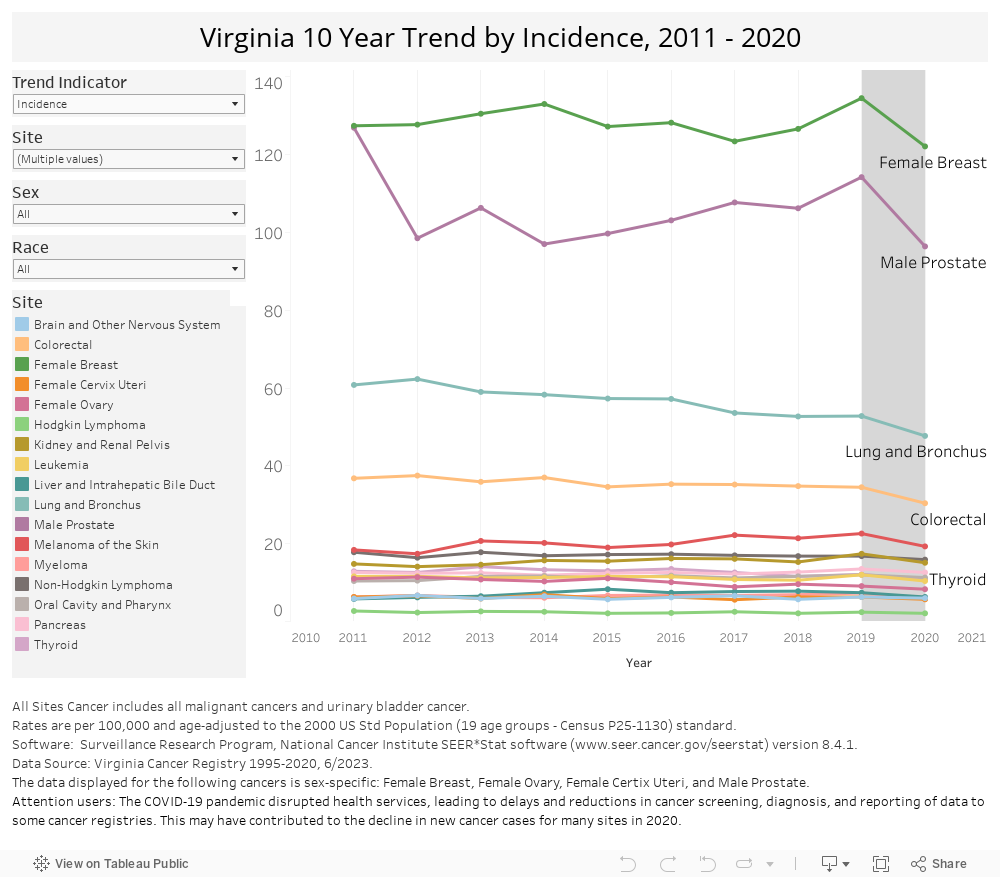
This 10 Year Trend dashboard displays individual cancer sites age-adjusted rates by race and sex in Virginia from 2011 to 2020. Use the “Trend Indicator” control to select either "Incidence" or "Mortality". Select the “Site”, “Sex”, and “Race” controls to filter further. You may select multiple sites for comparison. You can hover over a line on the graph to view details including the rate.
Shading has been added to the line graph between 2019 and 2020 due to potential impacts on cancer diagnosis from the COVID-19 pandemic. Declines in cancer incidence between 2019-2020 should be interpreted with caution.
* Rates and counts have been suppressed if counts are below 16, and will not display.
* Sex-specific cancer sites only reflect data from that population, i.e. female breast staging percentages only include female population data.