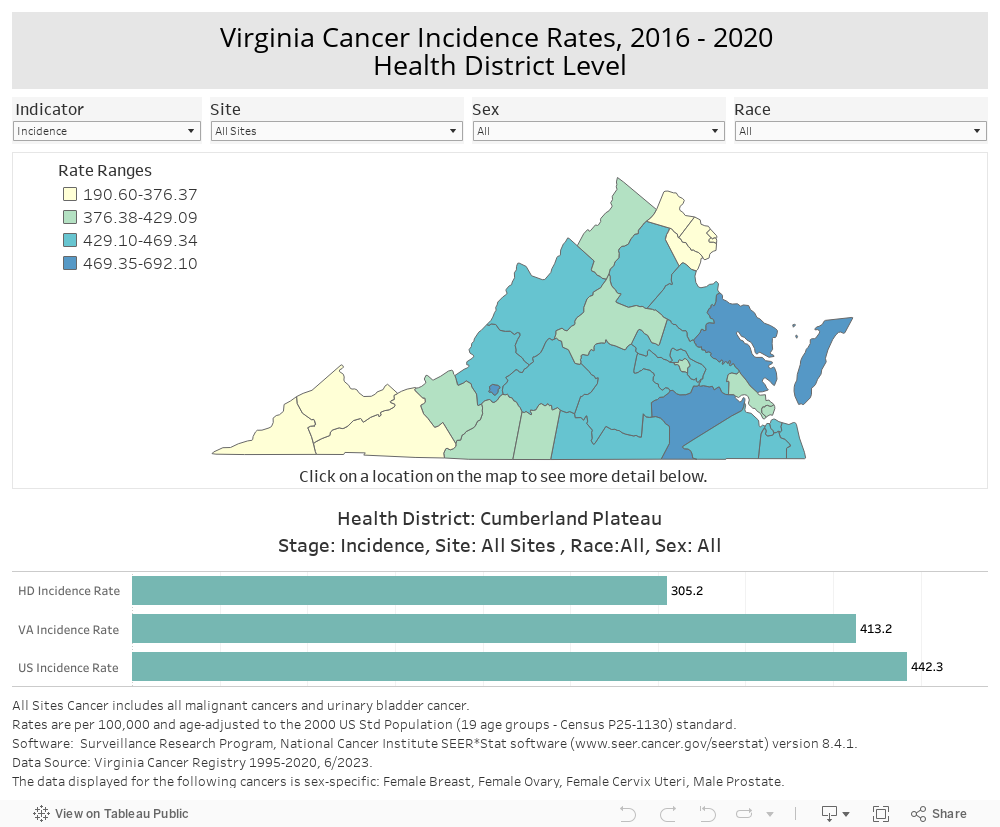
This Incidence/Mortality map displays cancer age-adjusted rates for the five-year period of 2016-2020. Use the “Indicator” control to choose between "Incidence" or "Mortality". Then use “Site”, “Sex”, and “Race” controls to filter changes in the map. Hover your cursor over a locality to see rates and counts for the health district, state, and nation.
* Rates and counts have been suppressed if counts are below 16 and will not display.
* Sex-specific cancer sites only reflect data from that population, i.e., female breast incidence rates only include female population data. Data are suppressed and not displayed when the sex indicator is set to “All” and a sex-specific site is chosen.