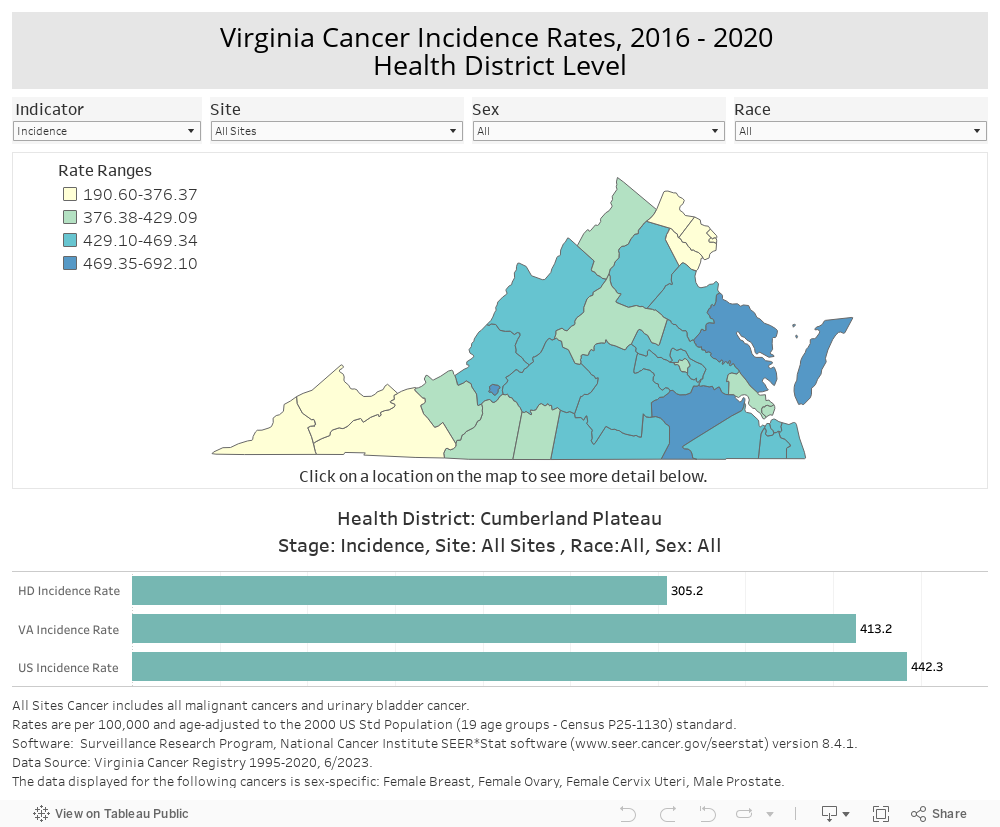
Dashboard Navigation Menu
This dashboard displays a map of age-adjusted cancer incidence and mortality rates for rolling five-year periods since 2016. Use the “Map Indicator” filter to choose between "Incidence" or "Mortality". Select additional options under “Year”, “Geography”, “Health District/Locality”, “Race and Ethnicity”, “Sex”, and “Cancer Site” to filter data in the map. Hover your cursor over the map to see rates and counts for the selected filter. Use the bottom section of the dashboard to compare the health district/locality to the state and nation. Please refer to the 'About the Data' section below the dashboard for more information and definitions used.
Incidence Data
Data Source: Cancer incidence data come from the Virginia Cancer Registry 1995-2022.
Software: The counts and rates are generated using Surveillance, Epidemiology, and End Results (SEER)*STAT software, version 8.4.5.
Population Estimates: Population estimates are obtained from SEER*Stat Database: Populations - Total U.S. (1969-2022), released April 2025. The National Cancer Institute (NCI) procures and maintains U.S. population data for the denominators of cancer incidence rates.
Age-adjusted Rates: Age-adjusted rates are presented as hospitalizations per 100,000 population. Incidence rates are adjusted (weighted) to the proportion of persons in each age group. The standard age-distribution of the U.S. population in 2000 is used to calculate age-adjusted rates. The benefit of age-adjusted rates compared with unadjusted (crude) rates is they allow for comparisons across groups (geography, ethnicity, race, and sex) of different age compositions. Starting in 2024, SEER*Stat changed the default age groups for population standardization from 19 to 20 groups by splitting age group 85+ into two groups: 85-89 and 90+. This change may result in rate changes in smaller localities.
Race: Data are shown for All races, Black (non-Hispanic) only, and White (non-Hispanic) only. American Indian/Alaskan Native and Asian/Pacific Islander are currently included in All Races. Hispanic incidence data are not shown prior to 2016 as it was not reliably reported to the Virginia Cancer Registry. The Virginia Cancer Registry is continuing to work on improving race/ethnicity classifications.
Sex: Sex is presented as Male, Female, or both Male and Female.
Sex-Specific Cancers: Data displayed for Breast, Cervix Uteri, Corpus and Uterus NOS, Ovary, and Prostate are sex-specific. Sex-specific cancer sites only reflect data from that population, i.e., female breast incidence rates only include female population data. Data are not displayed when the sex indicator is set to “Male and Female” and a sex-specific site is chosen.
Definitions:
- All Sites: includes all malignant cancers and urinary bladder cancer
- Brain and Other Nervous System: tumors in the brain and spinal cord
- Cervix Uteri: cancer that develops in the cervix, the lower part of the uterus that connects to the vagina
- Colorectal: a type of cancer that develops in the colon or rectum. It includes cecum, appendix, ascending colon, hepatic flexure, transverse colon, splenic flexure, descending colon, sigmoid colon, large intestine (not otherwise specified), rectosigmoid junction, and rectum
- Corpus and Uterus, not otherwise specified (NOS): cancer of the body of the uterus
- Esophagus: cancer that develops in the esophagus
- Female Breast: cancer that develops in the breast tissue
- Hodgkin Lymphoma: a type of cancer that affects the lymphatic system and it includes Hodgkin-nodal and Hodgkin-extra nodal
- Kidney and Renal Pelvis: cancer that develops in the kidney or renal pelvis
- Leukemia: cancer of the body's blood-forming tissues and it includes acute lymphocytic leukemia (ALL), chronic lymphocytic leukemia, other lymphocytic leukemia, acute myeloid leukemia (AML), acute monocytic leukemia, chronic myeloid leukemia, other myeloid/monocytic leukemia, other acute leukemia, aleukemic, subleukemic and not otherwise specified
- Liver and Intrahepatic Bile Duct: cancer that forms in the bile ducts within the liver.
- Lung & Bronchus: cancer that starts in the lungs or the airways (bronchi) that lead to the lungs
- Melanoma of the Skin: skin cancer that develops in melanocytes
- Myeloma: type of blood cancer that develops from plasma cells in the bone marrow
- Non-Hodgkin Lymphoma (NHL): cancer that originates in the lymphatic system. Includes NHL-Nodal and NHL-Extra Nodal.
- Oral Cavity & Pharynx: type of head and neck cancer that affects the mouth and throat. It includes lip, tongue, salivary gland, floor of mouth, gum and other mouth, nasopharynx, tonsil, oropharynx, hypopharynx, and other oral cavity & pharynx
- Ovary: cancer that develops in the ovaries, fallopian tubes, or peritoneum (the lining of the abdominal cavity)
- Pancreas: cancer that develops in the pancreas
- Prostate: cancer that develops in the prostate gland
- Stomach: cancer that arises in the stomach lining
- Thyroid: cancer that develops in the thyroid gland
- Urinary Bladder: cancer that develops in the cells lining the bladder
Other: Data are produced and processed from sources believed to be reliable and accurate at that point of time. Additionally, The Virginia Cancer Registry (VCR) improved their quality assurance process on cancer incidence data. We reviewed and and ensured patient residence information reported by healthcare providers, including hospitals, clinics, physician's offices, and laboratories were accurate, using a mapping tool recommended by the North American Association of Central Cancer Registries (NAACCR). The Virginia Cancer Registry continues to assess variations using a 95% confidence interval. Unknown/Unreported variables were removed from the tables. Counts and rates based on cases fewer than 16 are not shown in accordance with suppression rules by the US Cancer Statistics, Centers for Disease Control and Prevention.
Death Data
Data Source: Cancer death (mortality) data are obtained from the SEER*Stat Database. Death data are collected and maintained by the National Center for Health Statistics (NCHS), and are analyzed with the SEER*Stat software. Deaths are reported by the Virginia city or county where the decedent normally resided at the time of death, regardless of where the death occurred. It should be noted that death data are available a year ahead of incidence data. This is because incidence data generally have a longer lag due to extra time required for diagnosis, data collection, quality control, and dissemination.
Population Estimates: Population estimates are obtained from SEER*Stat Database: Populations - Total U.S. (1969-2023), released April 2025. The National Cancer Institute (NCI) procures and maintains U.S. population data for the denominators of cancer incidence rates.
Age-adjusted Rates: Age-adjusted rates are presented as hospitalizations per 100,000 population. Incidence rates are adjusted (weighted) to the proportion of persons in each age group. The standard age-distribution of the U.S. population in 2000 is used to calculate age-adjusted rates. The benefit of age-adjusted rates compared with unadjusted (crude) rates is they allow for comparisons across groups (geography, ethnicity, race, and sex) of different age compositions. Starting in 2024, SEER*Stat changed the default age groups for population standardization from 19 to 20 groups by splitting age group 85+ into two groups: 85-89 and 90+. This change may result in rate changes in smaller localities.
Causes of Death: International Classification of Diseases, Tenth Revision (ICD-10) medical coding are used to report underlying cause of death codes for malignant neoplasms, C00-C97.
Race/Ethnicity: Data are shown for All races, Black (non-Hispanic) only, White (non-Hispanic) only, and Hispanic (all races). American Indian/Alaskan Native and Asian/Pacific Islander are currently included in All Races. The Virginia Cancer Registry is continuing to work on improving display of race/ethnicity.
Sex: Sex is presented as Male, Female, or both Male and Female.
Sex-Specific Cancers: Data displayed for Breast, Cervix Uteri, Corpus and Uterus NOS, Ovary, and Prostate are sex-specific. Sex-specific cancer mortality only reflect data from that population, i.e., female breast mortality rates only include female population data. Data are not displayed when the sex indicator is set to “Male and Female” and a sex-specific site is chosen.
Other: Data are produced and processed from sources believed to be reliable and accurate at that point of time. Unknown/Unreported variables were removed from the tables. Counts and rates based on cases fewer than 16 are not shown in accordance with suppression rules by the US Cancer Statistics, Centers for Disease Control and Prevention.