
DISCLAIMER:
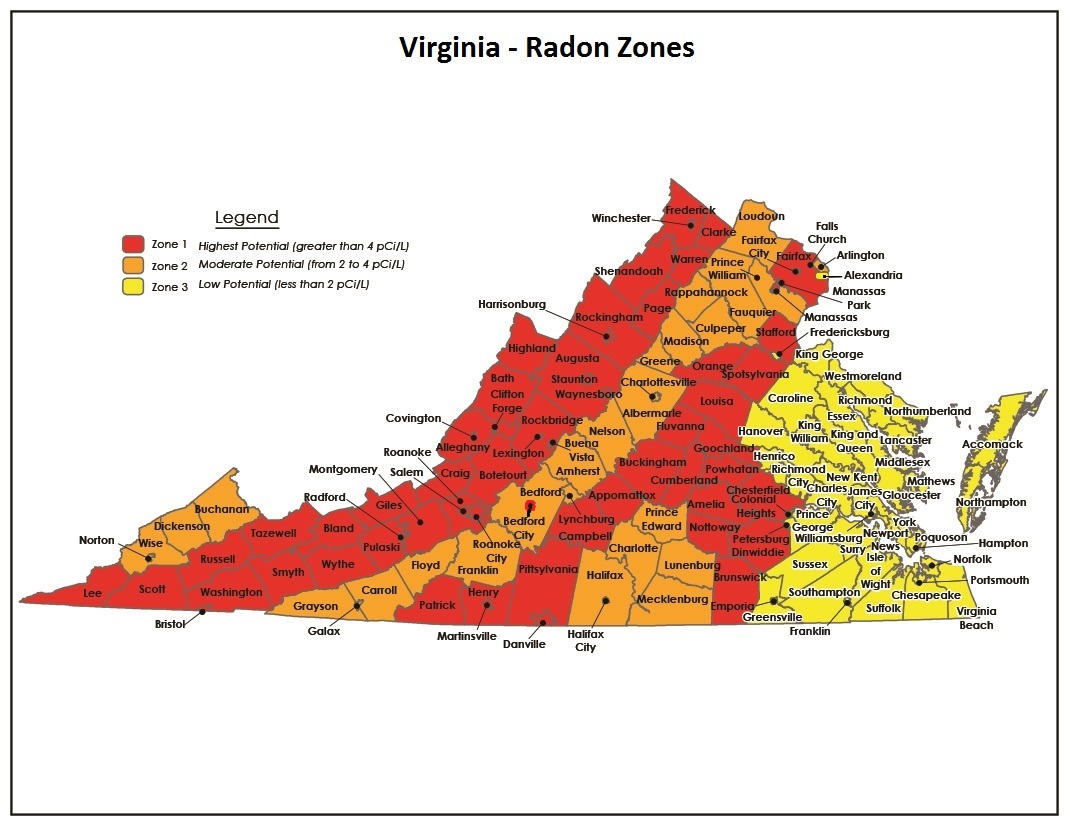
EPA produced a national radon risk map in 1994. The Virginia map shown above was part of this effort. The map was based on a very limited number of radon test results, existing knowledge of surface geological features/layers and measurements of background radiation. EPA currently has no plans to revise this map. This map was never intended to be used for predictive purposes, but only to provide a rough estimate of the chances of encountering high indoor radon levels in a particular jurisdiction.
To view a radon map displaying risk based on actual testing data, click this link: VDH Radon Risk Map . This map was developed using test results reported to VDH’s Radon Program from 2016-2024.
The only way to know if a particular home has a radon problem is to test for it. EPA & VDH recommend that all homes be tested for radon – especially those being purchased.
Generally in Virginia, the closer you get to the ocean the lower the odds of encountering high radon levels, but this is not a guarantee that high radon levels will never be found in these areas. High radon test results have been found in every Virginia County – including all of those designated as “low risk”. High radon levels in these areas may result when homes are built over small Uranium deposits, non-native fill material or when the foundation is cut into valleys or hillsides where they may encounter deeper geologic layers that are high in radon source material.
- Many homes built in the Williamsburg area at low elevations and/or cut into river valleys have shown high radon test results. See this article for more details: William & Mary radon study